View Analytics
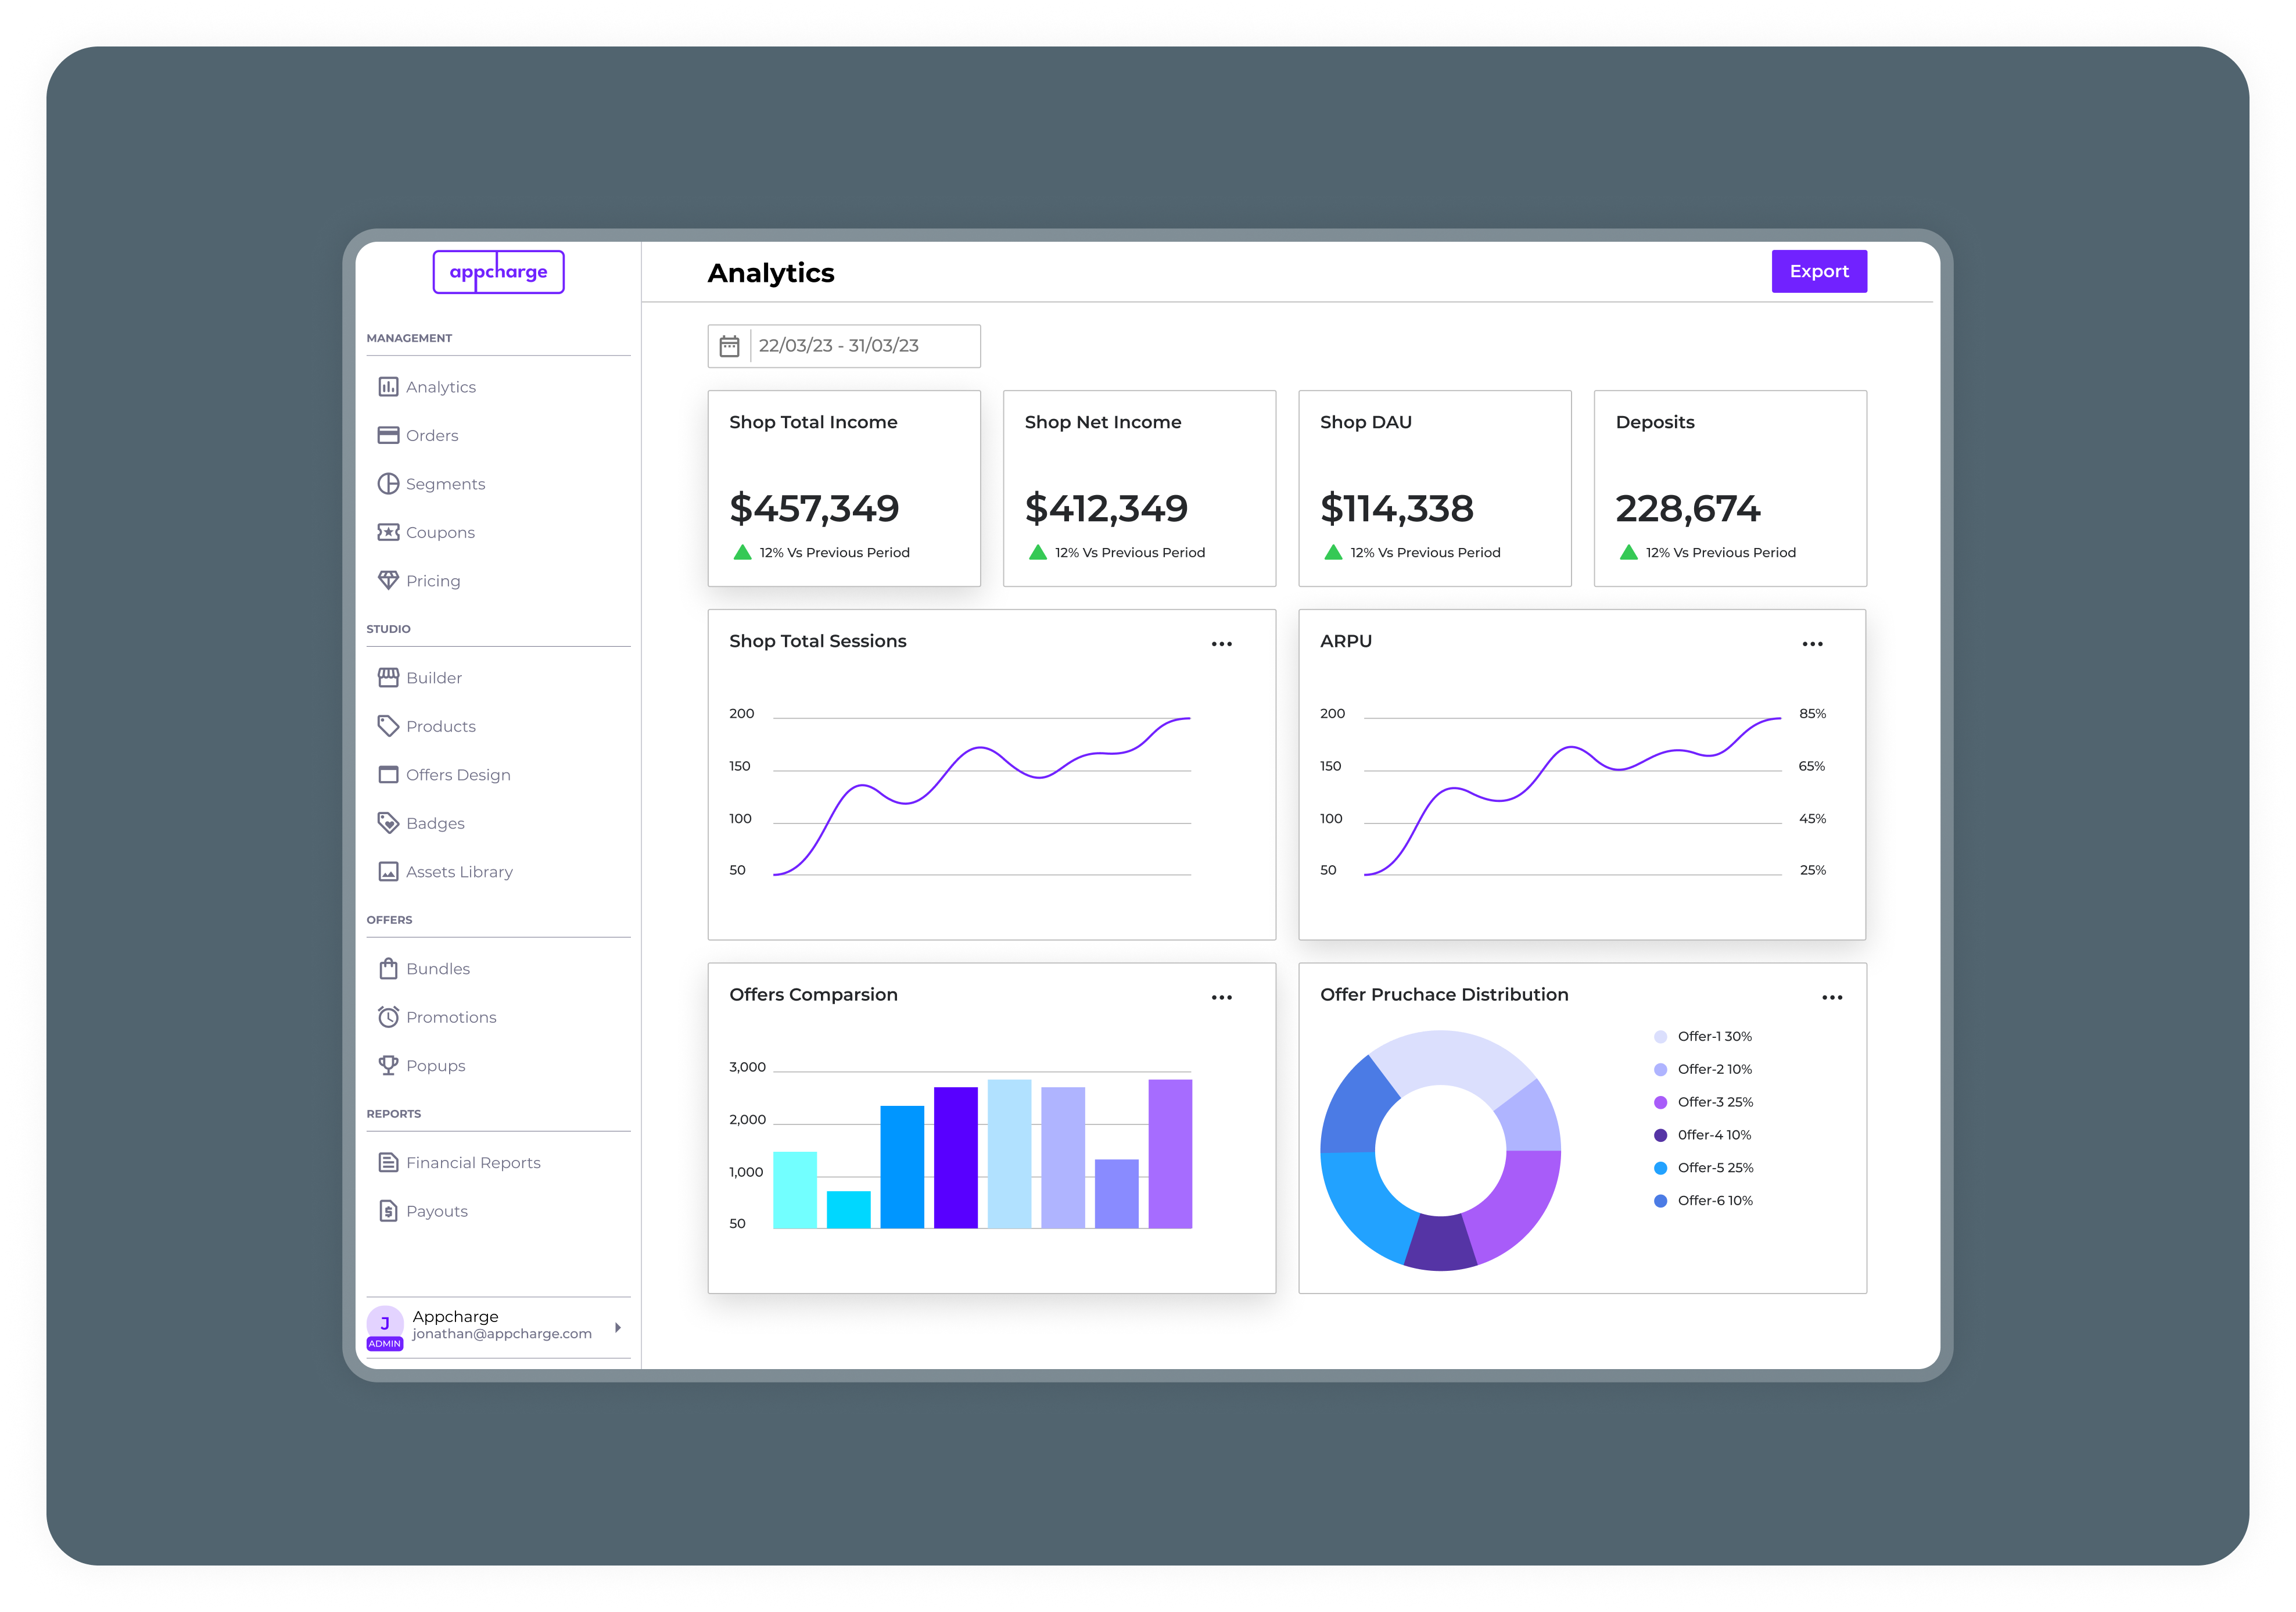
The Analytics Page in the Appcharge Publisher Admin Dashboard provides key insights into user behavior, revenue, and engagement, helping publishers make data-driven decisions. Metrics displayed include revenue, deposits, user activity, and conversion rates over a selected date range, with comparisons to previous periods to track performance trends.
Updates
- All dates are in UTC Now
- We are using a time picker to select the wanted date and time.
- All metrics have a build-it comparison to last week
- Hours breakdown is enabled only for a specific day.
Below are detailed descriptions for each metric on your dashboard analytics:
- Total Revenue Without Tax: This metric represents the sum of all revenue generated by the web store, excluding any taxes applied. It provides a clear view of the company’s income from sales before fee deductions.
- Total Deposits: This metric indicates the number of successful deposits/transactions by players within a specific period.
- ARPPU (Average Revenue Per Paying User): This metric calculates the average revenue generated from each paying player. It helps publishers understand the value derived from players who contribute directly to revenue, highlighting spending patterns and the effectiveness of monetization strategies.
- Average Deposits Per Depositor: This metric shows the average deposits/transactions count per depositor. Understanding how much each user typically contributes to deposits is crucial, helping to gauge player engagement and financial behavior.
- Depositors: This count reflects the number of unique players who have made at least one deposit. It is useful for assessing the size of your engaged player base.
- ARPU (Average Revenue Per User): This metric averages the total revenue generated by all active players, whether they pay or not. It is an important measure of overall revenue generation capability per web store player, providing insight into the overall economic value of the player base.
- Active Users: This metric counts the number of unique players engaged with the web store (post login) within the specific timeframe. It helps measure the player engagement and the active reach of the web store business.
- Total Sessions: This number represents the total count of individual sessions initiated by all players within a given period. It's useful for understanding user engagement levels and the frequency of interaction with the web store. Appcharge considered a session to be any activity within a one-hour period.
- Average Daily Active Users: This metric shows the average number of unique players actively using (post login) the web store daily. It helps track daily user engagement and the service's stickiness. It is relevant only if you choose more than one day in the time picker.
- Conversion Rate: Appcharge measures the player conversion rate percentage as the proportion of total deposits divided by total sessions. It's crucial for evaluating the effectiveness of conversion strategies and user interest.
Updated 5 months ago